Plotting a 3D UAV with Matplotlib
If you are visualizing anything with Python, Matplotlib is probably going to be an essential tool. While the library provides really great set of plotting functions, I had a hard time when I was trying to plot a 3D UAV. So, I created kanishkegb/pyplot-3d to provide an easy way to do this. This is not necessarily limited to plotting a UAV, but also includes object-based examples on how to create a generic 3D object for plotting.
For example, the UAV is actually a collection of 3D plotting objects such as arrows and spheres. The objects are formulated such that providing a rotation and/or translation to the main object ensure the correct transformation of the other objects the main 3D object is composed of.
Static Plot
The library provides a few basic objects such as UAV, Sphere, Line, Arrow, and Camera. The user can simply import them to their plots. For example, drawing a UAV is as easy as:
# Import all the libraries
from pyplot3d.uav import Uav
from pyplot3d.utils import ypr_to_R
import numpy as np
import matplotlib.pyplot as plt
plt.style.use('seaborn')
# Initialize plot
fig = plt.figure()
ax = fig.gca(projection='3d')
arm_length = 0.24 # in meters
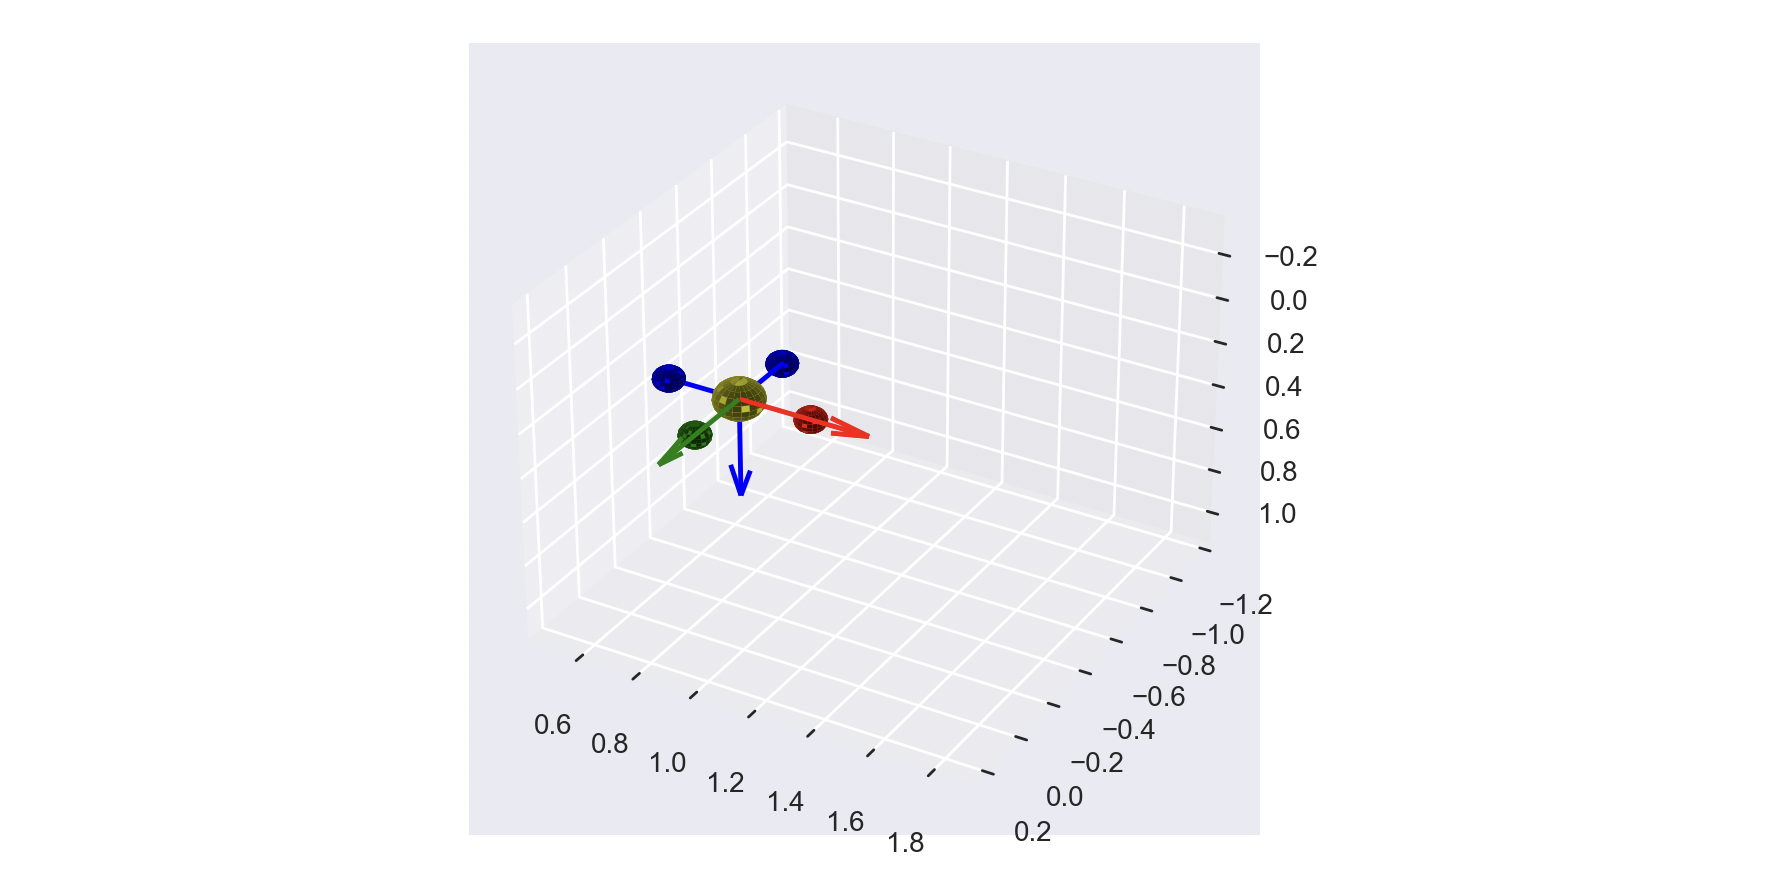
uav = Uav(ax, arm_length)
uav.draw_at([1, 0, 0], ypr_to_R([np.pi/2.0, 0, 0]))
# Show the plot
plt.show()
This generates the image shown at the top of this page.
Animated Plot
You can use this with the animation package to create a moving plot like below.

import numpy as np
from matplotlib import pyplot as plt
from matplotlib import animation

from uav import pyplot3d.Uav
from utils import pyplot3d.ypr_to_R


def update_plot(i, x, R):
    uav_plot.update_plot(x[:, i], R[:, :, i])

    # These limits must be set manually since we use
    # a different axis frame configuration than the
    # one matplotlib uses.
    xmin, xmax = -2, 2
    ymin, ymax = -2, 2
    zmin, zmax = -2, 2

    ax.set_xlim([xmin, xmax])
    ax.set_ylim([ymax, ymin])
    ax.set_zlim([zmax, zmin])


plt.style.use('seaborn')

fig = plt.figure()
ax = fig.gca(projection='3d')

arm_length = 0.24  # in meters
uav_plot = Uav(ax, arm_length)


# Create some fake simulation data
steps = 60
t_end = 1

x = np.zeros((3, steps))
x[0, :] = np.arange(0, t_end, t_end / steps)
x[1, :] = np.arange(0, t_end, t_end / steps) * 2

R = np.zeros((3, 3, steps))
for i in range(steps):
    ypr = np.array([i, 0.1 * i, 0.0])
    R[:, :, i] = ypr_to_R(ypr, degrees=True)

ani = animation.FuncAnimation(fig, update_plot, frames=20, fargs=(x, R,));

# If using Jupyter Notebooks
# from IPython.display import HTML
# HTML(ani.to_jshtml())