Adding an Interactive Plotly Plot to a Markdown Page
If you are using Python for visualizing data, plotly is an awesome open-source library (also, plotly is not limited to Python). This let you plot interactive plots instead of the static plots Matplotlib generates by default.
First, we need to install plotly. Assuming you already have Python installed in your system, it as simple as:
python3 -m pip install plotly
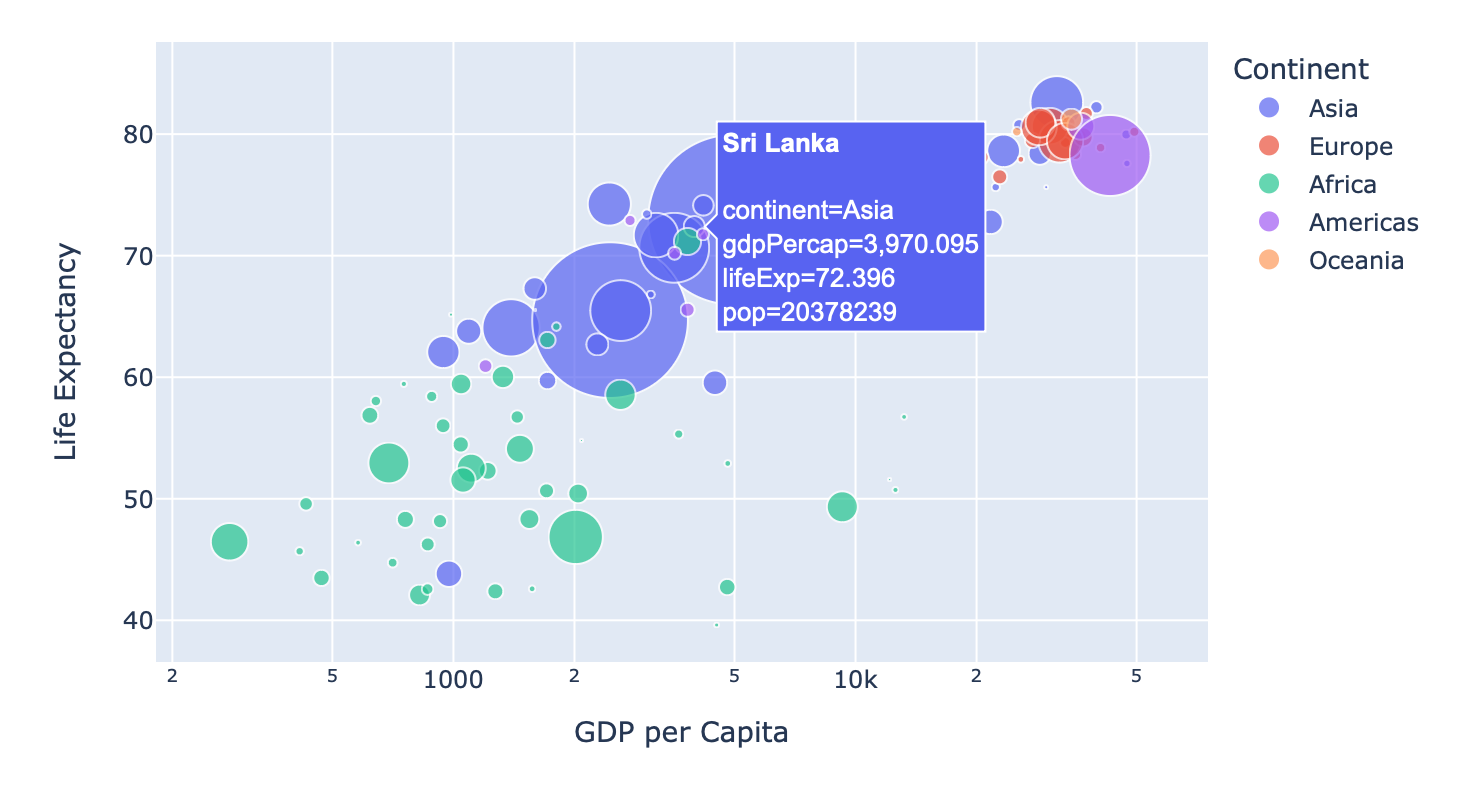
Then, we need to generate a plot. For that, I am going to use a default dataset that comes with plotly, and an example code.
import plotly.express as px

df = px.data.gapminder()
fig = px.scatter(
        df.query("year==2007"),
        x="gdpPercap", y="lifeExp",
        size="pop", color="continent",
        hover_name="country", log_x=True, size_max=60
    )
fig.show()

fig.write_html('plotly_example.html', full_html=False, include_plotlyjs='cdn')
The last line (write_html) exports the image to an HTML file, and the additional arguments are for optimizing the file size of the HTML file.
Without those, the write_html will create a self-contained HTML with the plotly.js source-code, which is useful for offline use, but not that much relevant for a website.
Once the HTML file is generated, copy/move that file to the directory where your website resides. Then, add the following line to your markdown page:
{ % include_relative relative/path/to/plotly_example.html % }
NOTE: Make sure to delete the space between the curly braces and the percentage signs. I had to keep the space here to avoid markdown parsing the line.
Of course, replace relative/path/to/ with the actual relative path.
For example, if both markdown and the HTML files are in the same directory, this will be,
{ % include_relative plotly_example.html % }
Now, you should be able to see the interactive image on your website, similar to the below plot. You can interact with your mouse, zoom in, check data points, or save the image as a PNG file.